Figure 1 shows the “SNP data filter” tab page selected in QTLmax. The input data is a genome data file (*.ped and *.map). When you select the genome data file, you will see that the “Population size” box and the “SNP set size” box are automatically filled with values. (Figure 1)
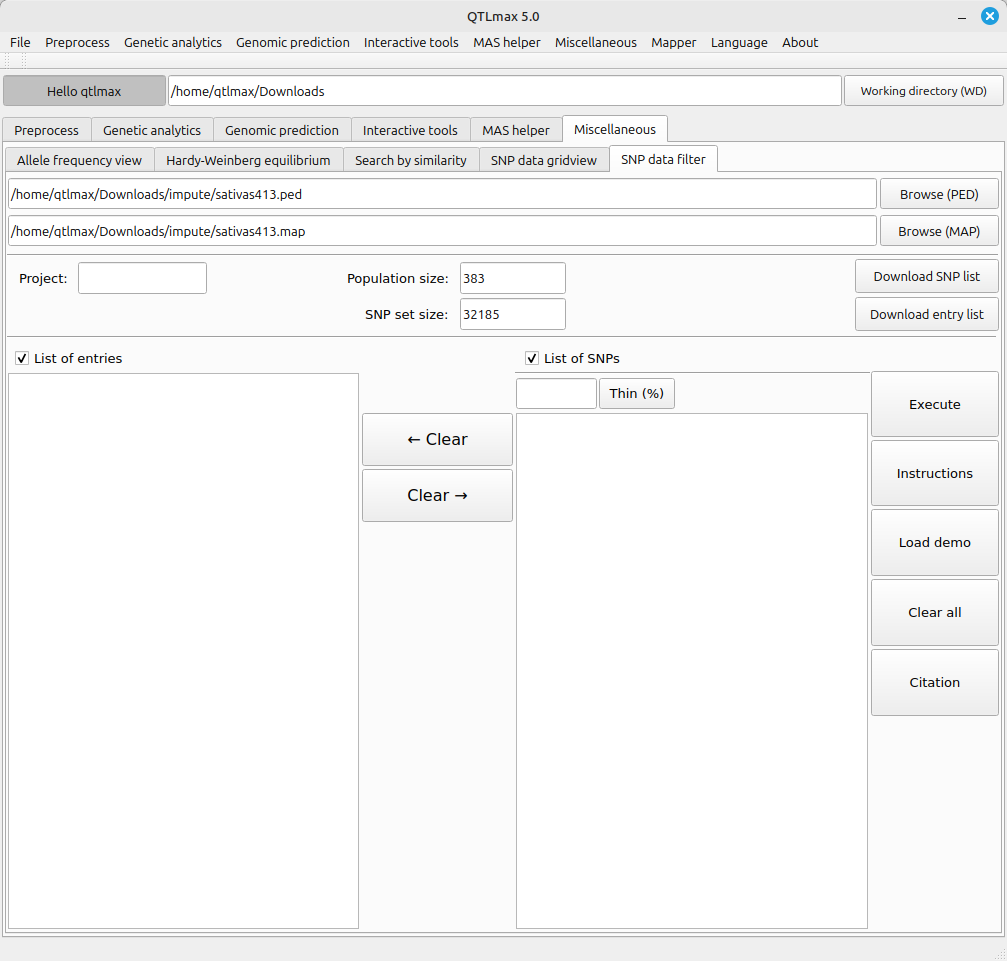
(Figure 1)
If you have a list of entries for the resulting subset, check the box labeled “List of entries” and enter the names in the corresponding text box; otherwise, the subset will include all entries. The same applies to the box labeled “List of SNPs.” Given the List of SNPs, you can take one of the following two ways:
- Enter a proportion value, followed by pressing [Thin (%)] button.
- Enter the names in the corresponding text box.
Please note that if you want to view a list of all entries and/or all SNPs, press the [Download SNP list] button and/or [Download entry list] button.
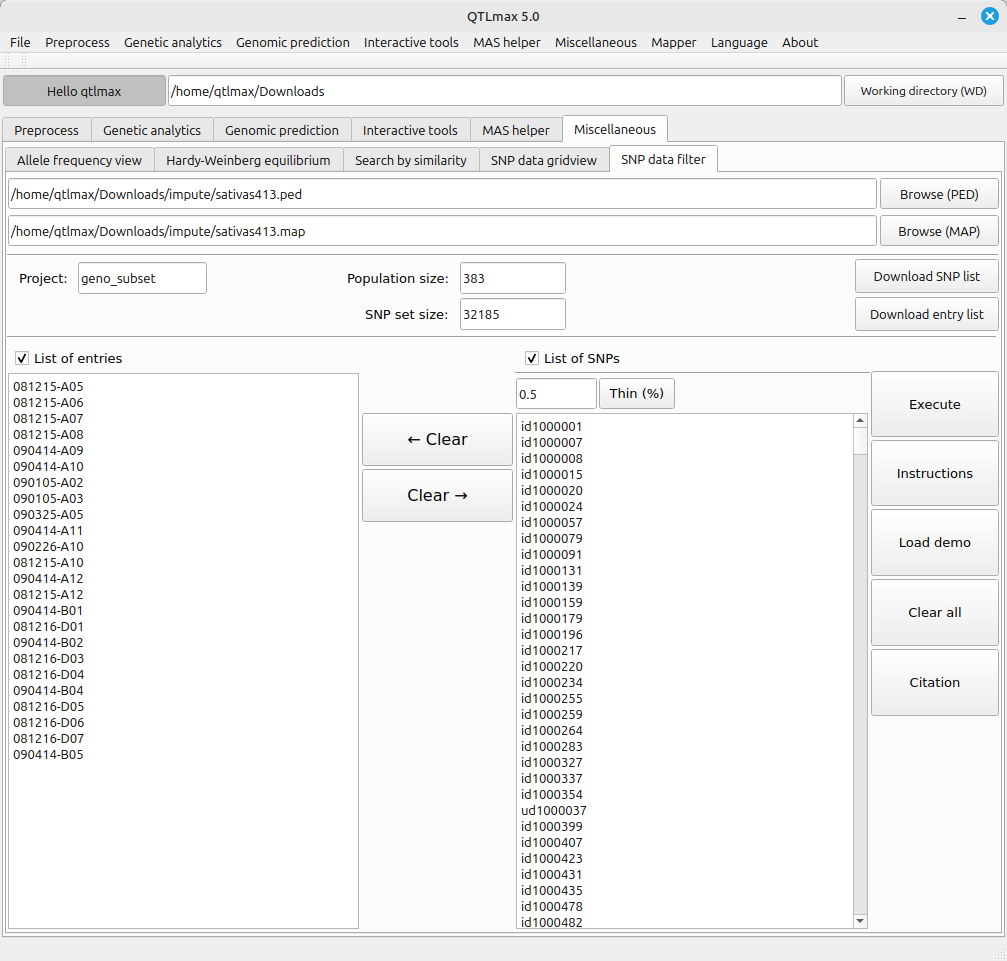
(Figure 2)
Clicking the [Execute] button generates SNP subset data following the configured settings. If you go to the project folder, you will find the resulting subset data files (*_subset.ped and *_subset.map). (Figure 3)