The “Heatmap” tab page has many setting options. If you don’t want to select each setting option individually, just click the [Load demo] button. You’ll see that most of the setting options are configured automatically (Figure 1). The input data format is a phenotypic CSV (*.csv) file that includes environmental factors. After replacing the demo data with your own data, you can freely change the settings to your desired values.
You will see the header values of the entered phenotypic data appear as a list within the “Columns” box. Select the trait column from the list and click the [Trait] button at the bottom; that trait will then be selected. Similarly, select the environmental factor column and click the [X variable] button, and the items for that column will be listed in the “X variable” table. In the same way, select the sample column and click the [Y variable] button, and the items for that column will be listed in the “Y variable” table. (Figure 1)
Select the desired items from the “X variable” table and the “Y variable” table. If you want to select all items, simply check the “Check all” box.
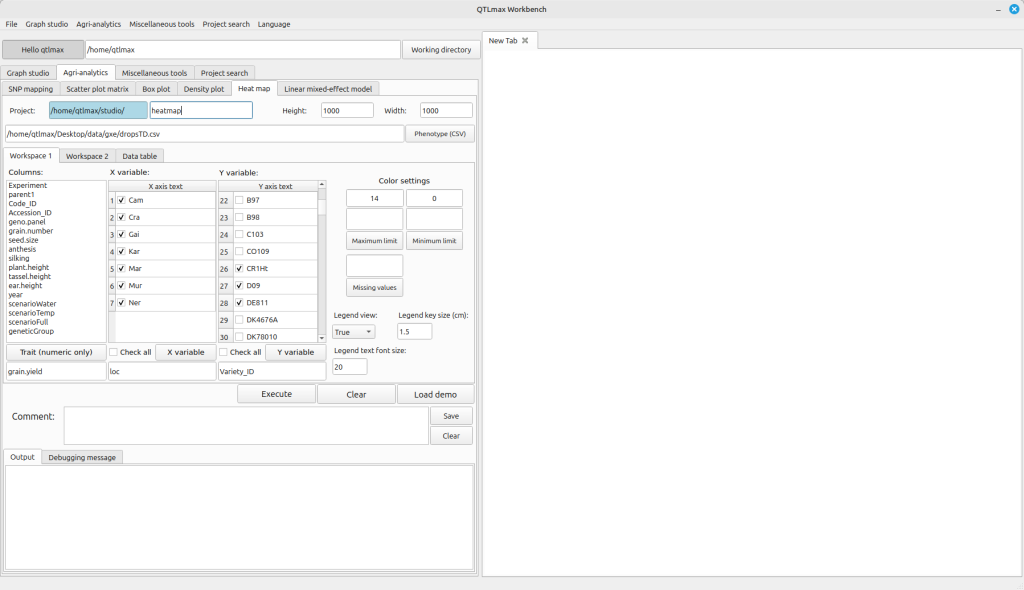
(Figure 1)
Click the [Maximum limit] button. In the pop-up palette window, select the color for the largest phenotypic value. Similarly, select the colors for the smallest value and for missing values. (Figure 2)
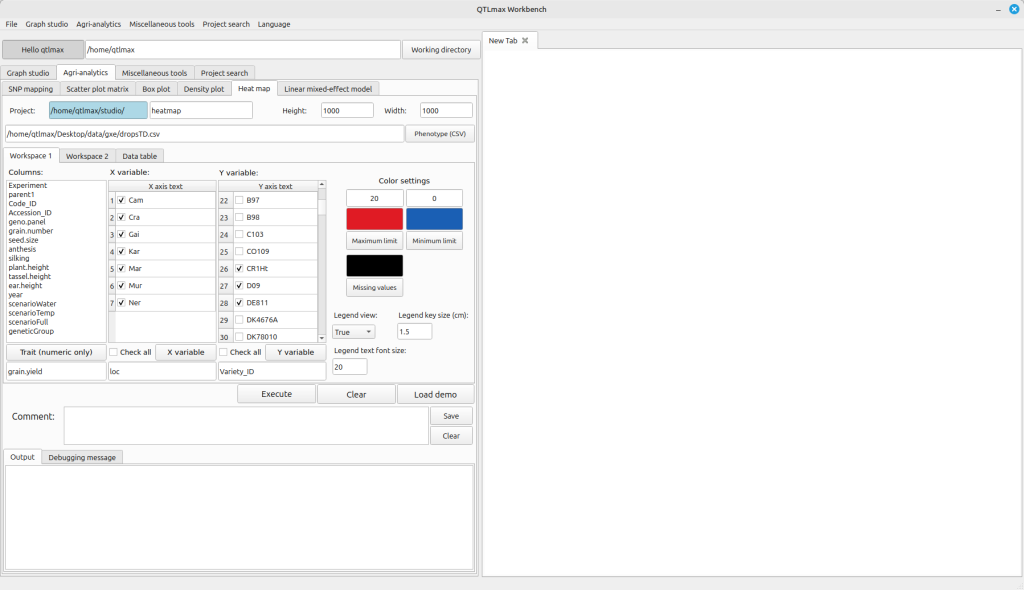
(Figure 2)
Go to the Workspace 2 tab page and select whether to display the Main title. If you check the display option, enter the Main title value. Once all settings are complete, click the [Visualize] button, and you’ll see the Density plot appear on the right-hand drawing panel (Figure 3).
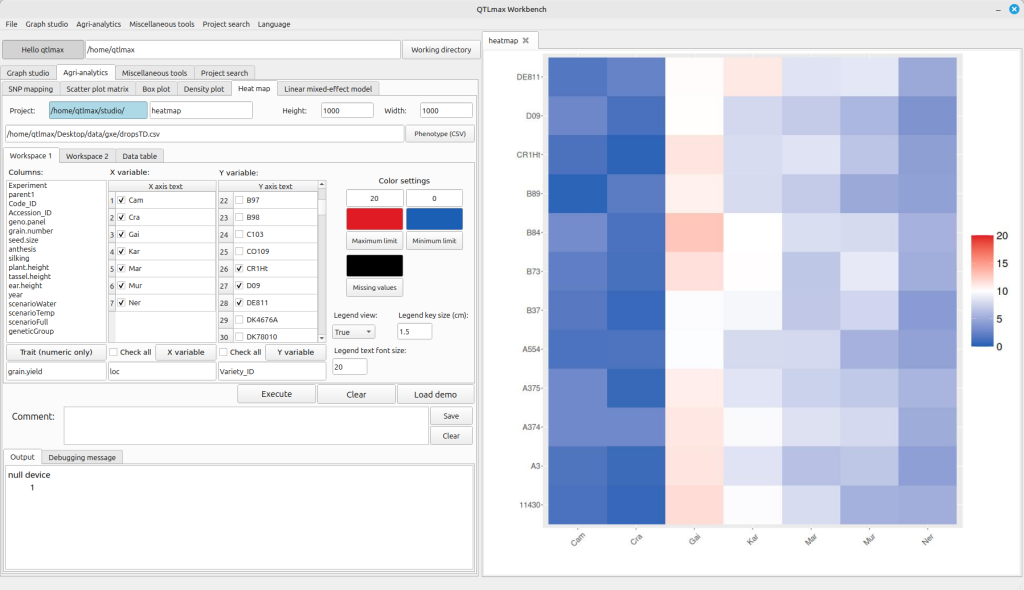
(Figure 3)