Figure 1 shows the “Linear mixed-effect model” tab page selected within QTLmax Workbench.
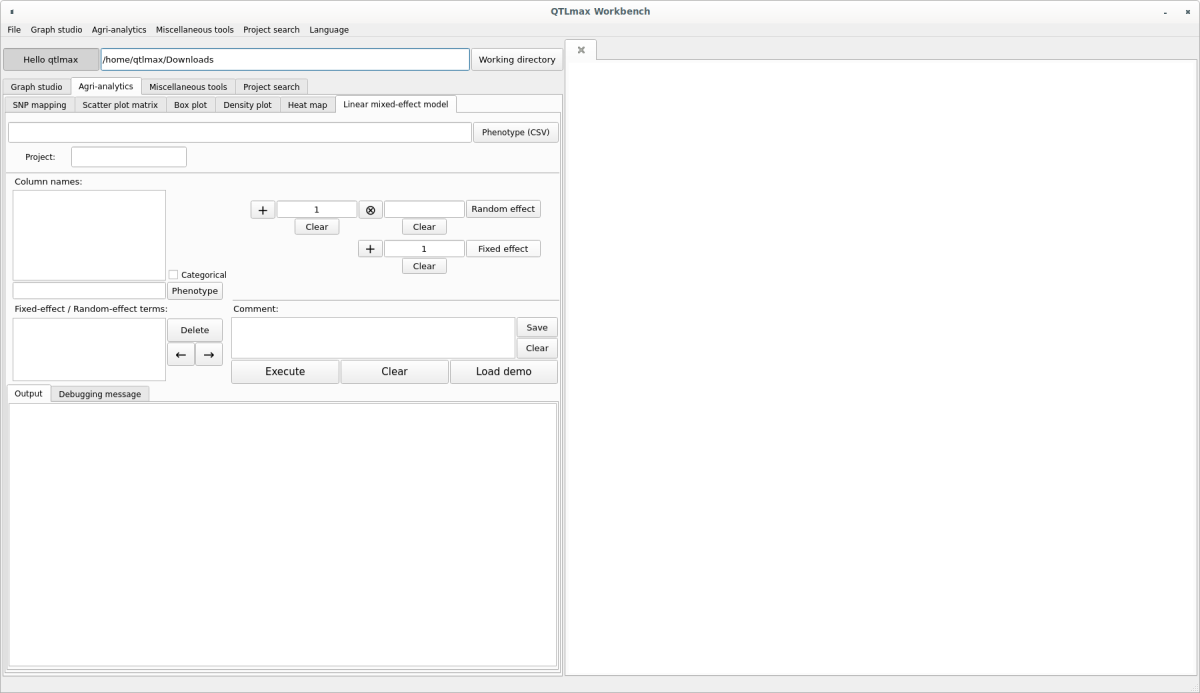
(Figure 1)
The input data format is a phenotypic CSV (*.csv) file that includes environmental factors. When you select an input file, the header values of the phenotypic data will appear as a list in the “Column names” box. From this list, select the phenotype you want to analyze and click the [Phenotype] button; that phenotype will then be selected (Figure 2). If the selected phenotype is categorical data, check the “Categorical” box.
If a Random effect factor that you want to include in your modeling exists in the “Column names” list, select that item and press the  button, followed by pressing the [Random effect] button; the item will be displayed in the “Fixed-effect / Random-effect terms” box in the format
 (1 | random-effect factor) (Figure 2). Similarly, if a Fixed effect factor that you want to include in your modeling exists in the “Column names” list, select that item, press the  button, and then click the [Fixed effect] button to display it in the “Fixed-effect / Random-effect terms:” box.
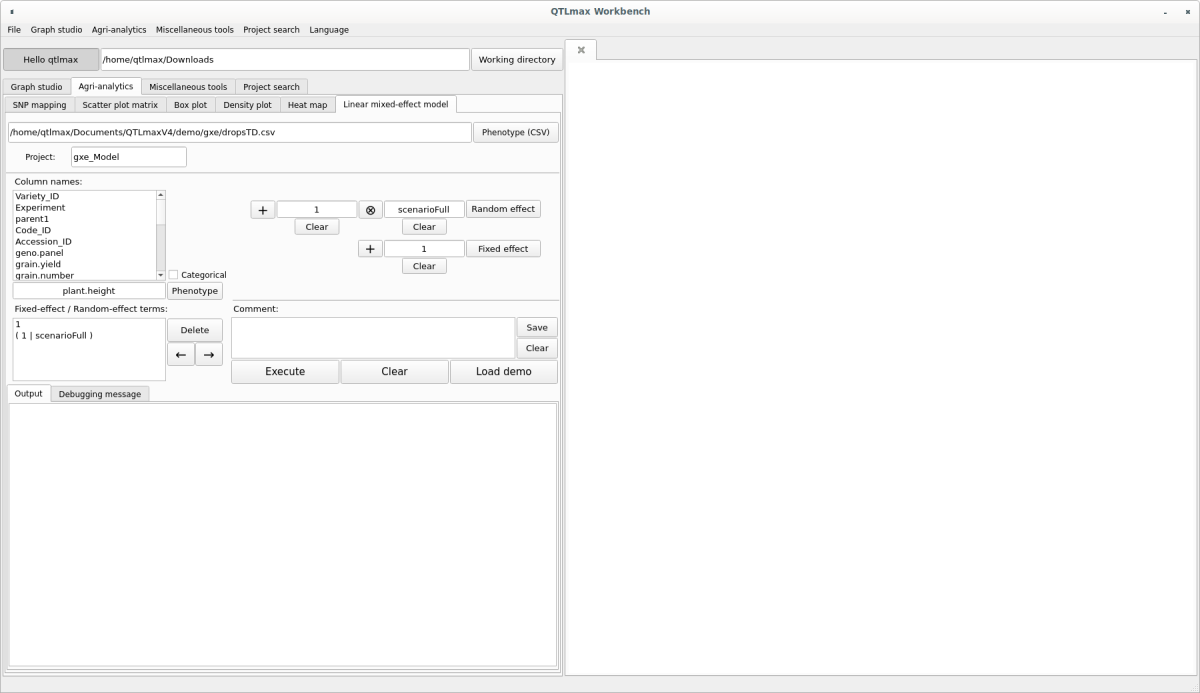
(Figure 2)
After all settings are complete, click the [Execute] button, and the results of the Linear mixed-model effect analysis will appear at the bottom (Figure 3). This analysis used the “lme4” R package. For more detailed information, please click the following link.
https://cran.r-project.org/web/packages/lme4/lme4.pdf
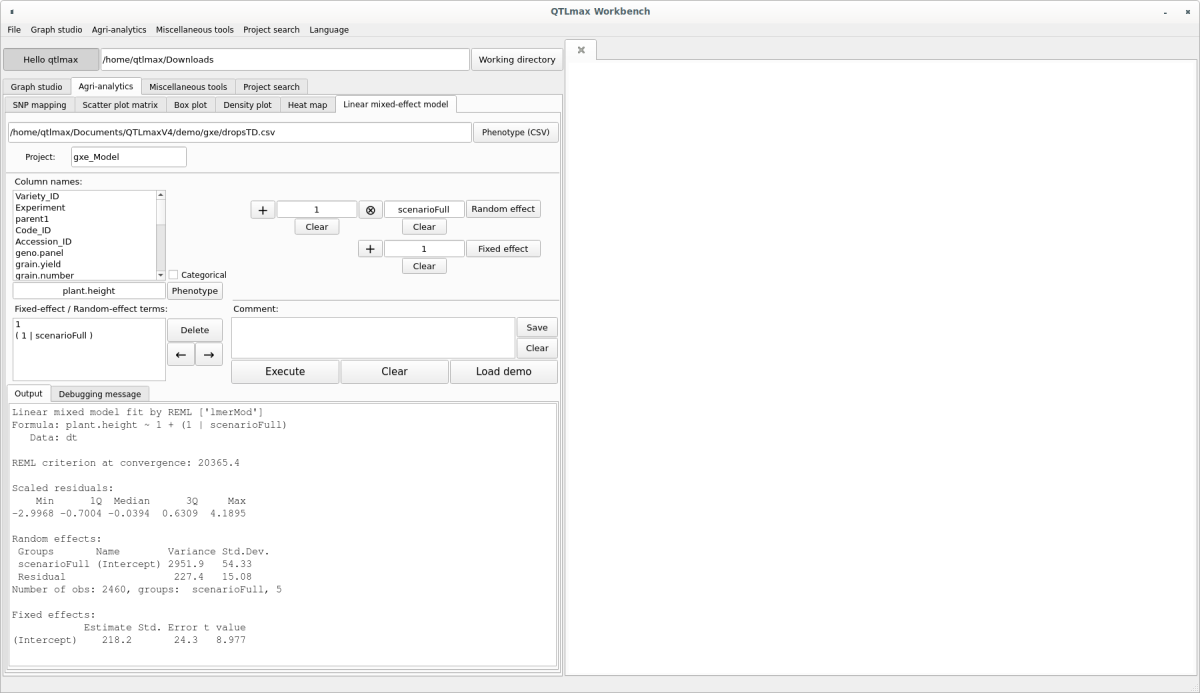
(Figure 3)