Figure 1 shows the Genomic Prediction tab page with both genomic and phenotypic data loaded. Once both datasets are input, the Training set size, Predictive set size, and Map size values are all automatically populated. Additionally, the header values from the phenotypic data file are listed in the “Trait” text box. (Figure 1) Figure 1 shows that the Training set size and Predictive set size are indicated as 350 and 33, respectively. This means that the 350 entries have both genomic and phenotypic datasets, making them usable for training. The 33 entries with only genomic data are for phenotypic prediction. (Figure 1)
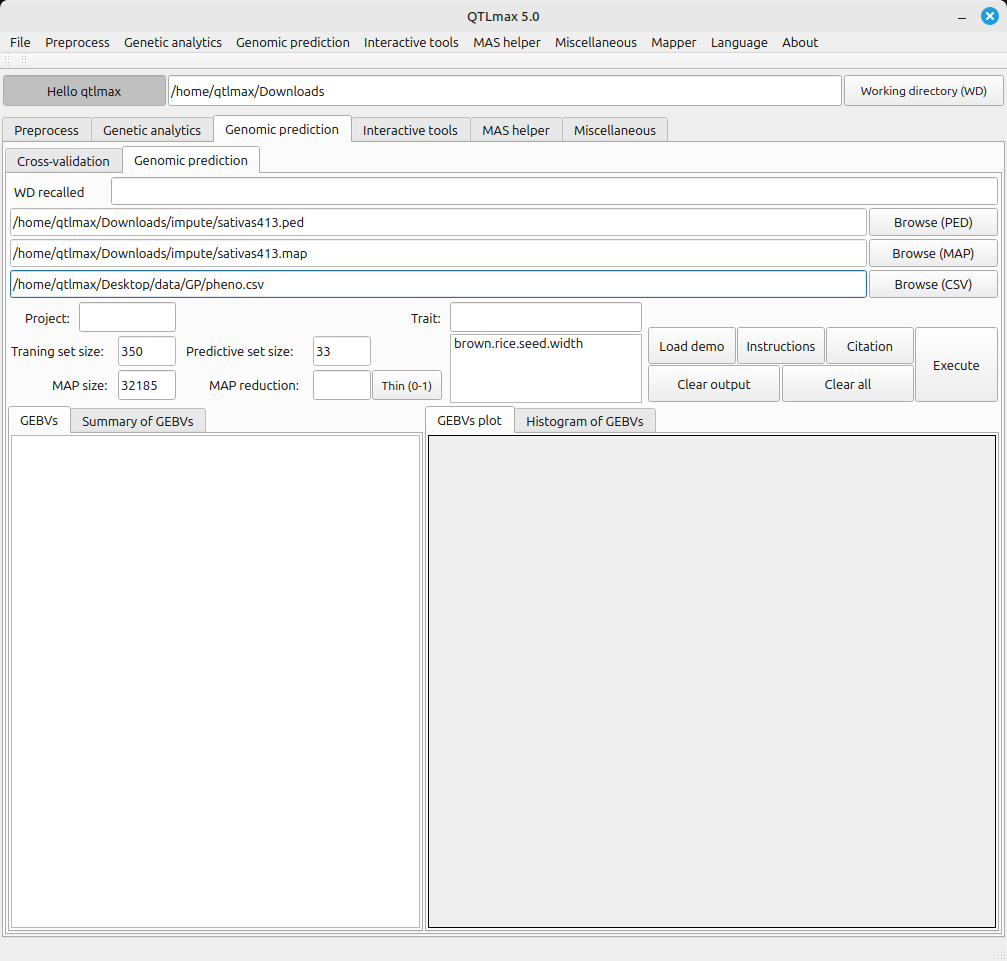
(Figure 1)
Figure 2 displays all the configured settings for Genomic Prediction. A Map reduction of 0.5 is shown, meaning that a half of all markers are subject to being in use by pressing the [Thin (0-1)] button. After completing all settings, clicking the [Execute] button will start the Genomic Prediction process.
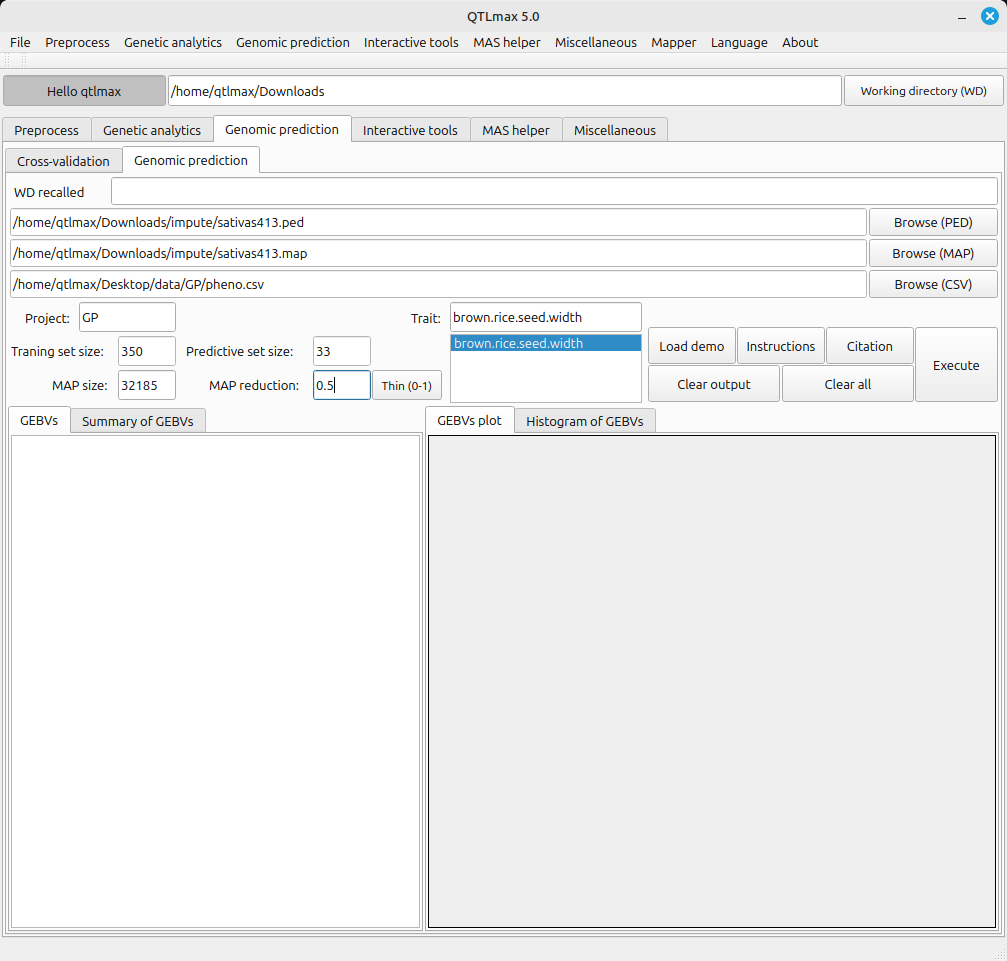
(Figure 2)
Figure 3 shows the completed Genomic Prediction calculations. The information provided by each tab is as follows:
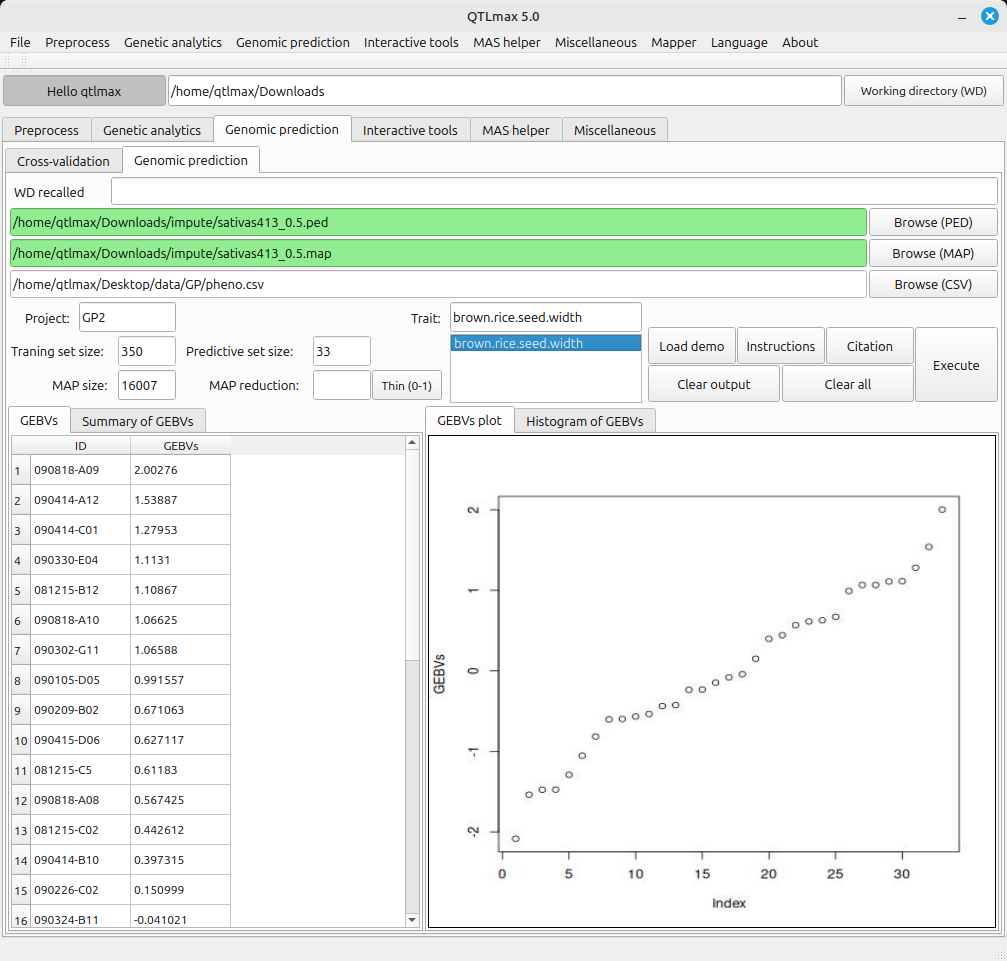
(Figure 3)
- GEBVs: Displays the genomic estimated breeding values obtained from the Genomic Prediction calculations.
- Summary of GEBVs: Shows a summary of the GEBVs results.
- GEBVs Plot: Displays a plot showing the sorted GEBVs results.
- Histogram of GEBVs: Shows a histogram generated from the GEBVs results.