The principle of cross-validation is simple: a population with both genomic and phenotypic data is randomly divided into N groups. N-1 of these groups are used as the training set, and one group is designated as the validation set. In the training set, the marker-effect of each SNP is calculated. These calculated marker-effect values from the training set are then applied to the SNP data in the validation set to predict the phenotypic values of individuals within the validation set. By calculating the Pearson correlation between the actual phenotypic values and the predicted phenotypic values of the individuals in the validation set, the accuracy of genomic prediction can be determined. This procedure is repeated multiple times, and then an average value is calculated to precisely determine the genomic prediction accuracy.
Figure 1 shows the Cross-validation tab page with both genomic and phenotypic data loaded. Once both datasets are input, the Population set size and Map size values are all automatically populated. In addition, the header values from the phenotypic data file are listed in the “Trait” text box (Figure 1).
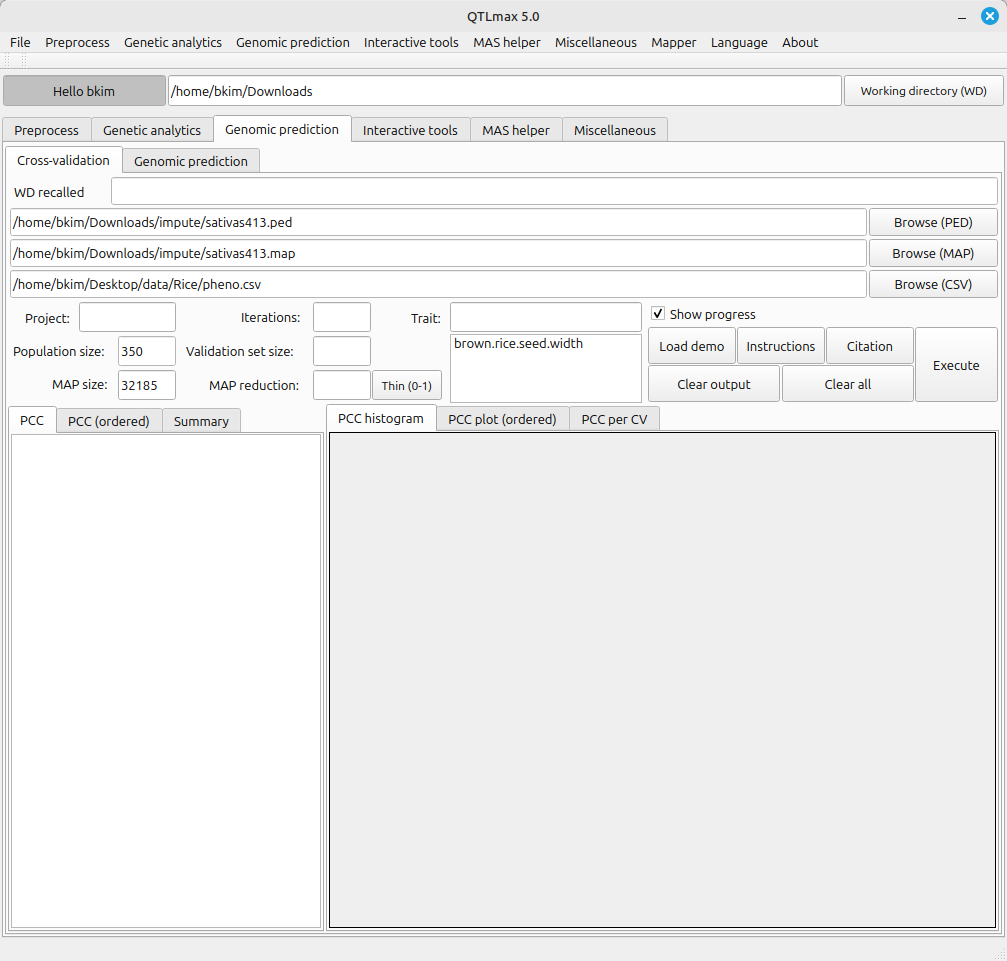
(Figure 1)
On the Cross-validation tab page, you can reduce the size of SNP set to be utilized for cross-validation. To this end, enter the desired number of SNPs into the text box labeled MAP reduction, then click the [Thin (0-1)] button.
Once you do this, the specified number of SNP markers will be extracted. Note that the marker sampling is made at random by using PLINK 2.0. You’ll also notice that the previously loaded SNP data file is replaced with the newly generated SNP data file, and the corresponding text box changes to a light green color (Figure 2).
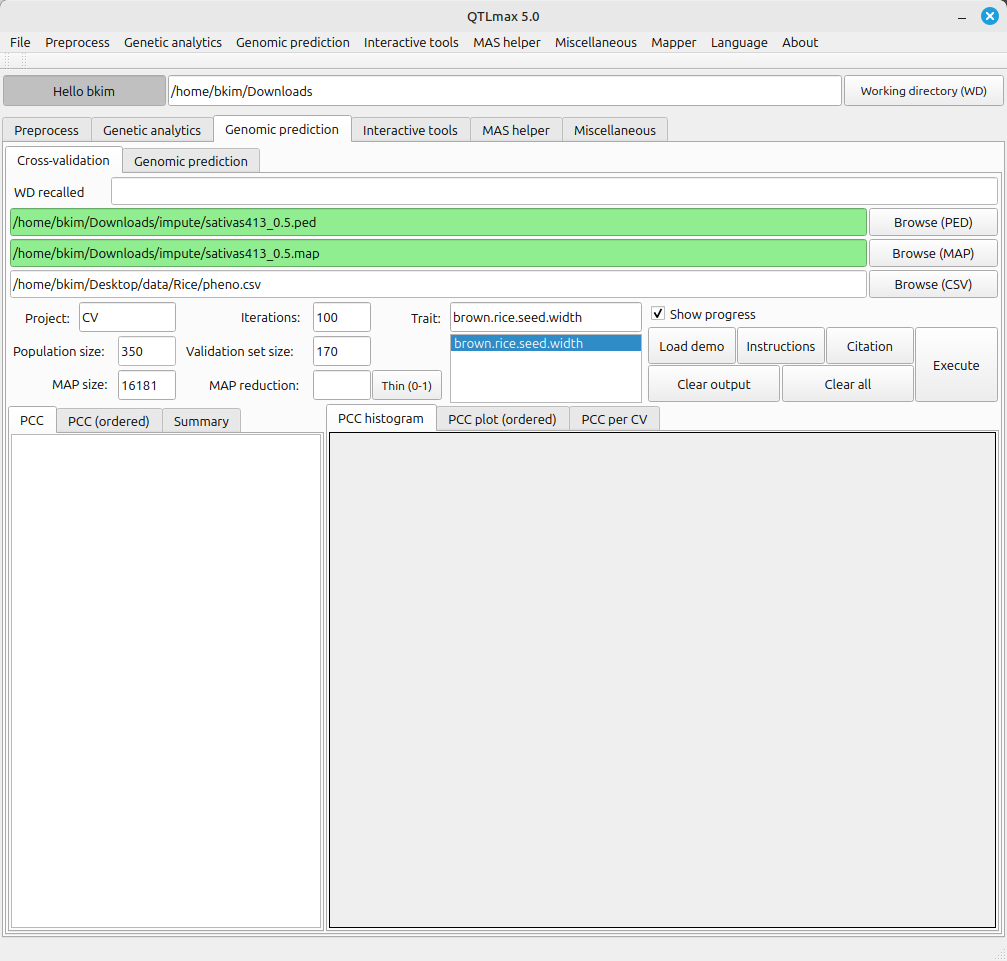
(Figure 2)
Figure 2 displays all the configured settings for Cross-validation. The Map reduction value of 0.5 indicates that 50% of markers were selected from the total available markers. The validation set size is set to 175, meaning that 175 individuals were randomly selected from the total of 350 individuals to be designated as the validation group. An Iterations value of 100 instructs the system to perform Cross-validation 100 times.
Once all settings are complete, clicking the [Execute] button will start the Cross-validation process, and a terminal will pop up. This pop-up terminal will show the progress of the calculations.
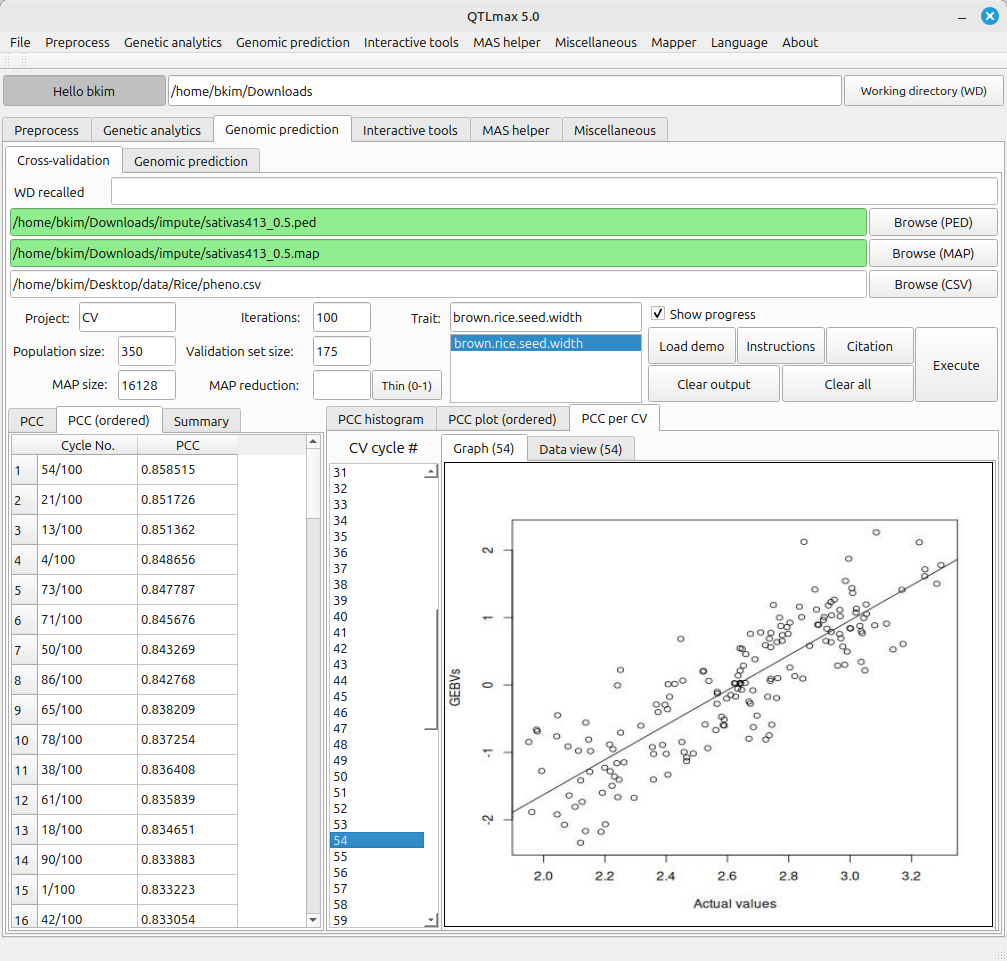
Figures 3-1 and 3-2 show the completed Cross-validation calculations. The information provided by each tab page is as follows:
- PCC: PCC stands for Pearson Correlation Coefficient results. (This tab displays the Pearson correlation coefficients between the GEBVs (Genomic Estimated Breeding Values) results and the actual phenotypes.)
- PCC (ordered): This tab shows the Pearson Correlation Coefficient results in descending order.
- Summary: This tab provides a summary of the Pearson Correlation Coefficient results.
- PCC histogram: This tab displays a histogram generated from the Pearson Correlation Coefficient results.
- PCC plot (ordered): This tab shows a plot where the Pearson Correlation Coefficient results are displayed in sorted order.
- PCC per CV: This tab displays the Pearson Correlation Coefficient results obtained from each cross-validation cycle.