In this post, we will perform the task of visually marking specific SNP locations on the genome by using QTLmax Workbench.
[Figure 1] shows the “SNP mapping” tab page selected in QTLmax Workbench.
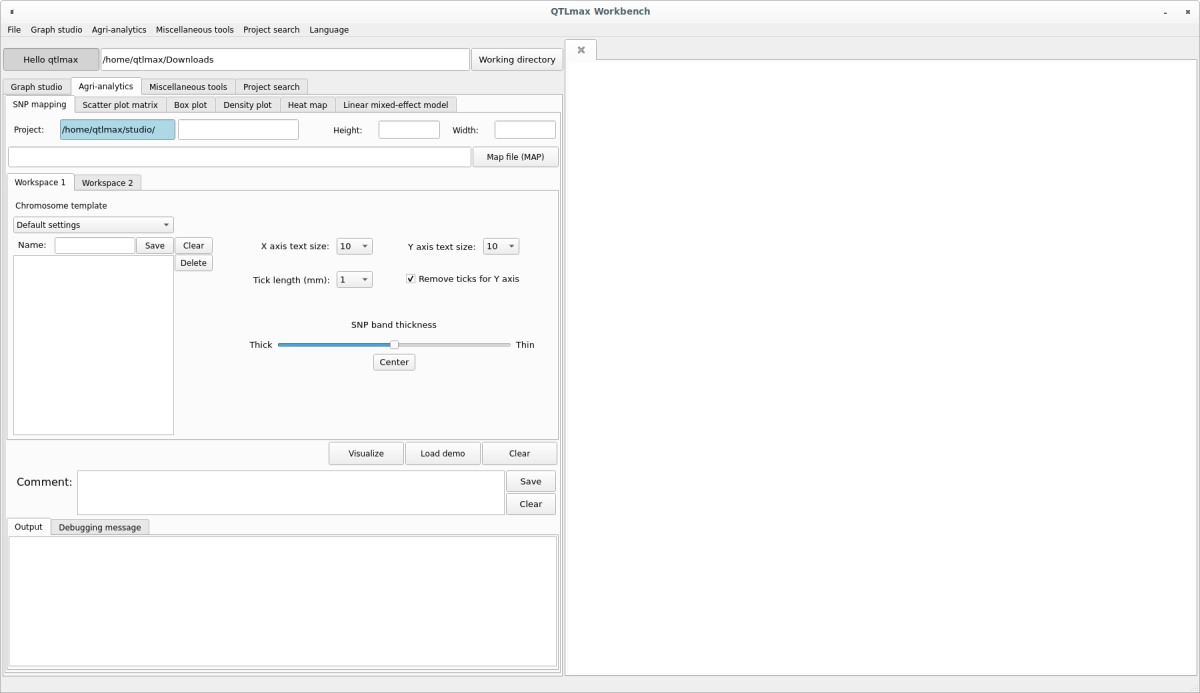
(Figure 1)
he ‘SNP mapping’ tab page has many setting options. If you don’t want to select each setting option individually, just click the [Load demo] button. You’ll see that most setting options are automatically configured (Figures 2, Figure 3). The format of the input data is a Map (*.map) file. After replacing the demo data with your own data, you can freely change the settings to your desired values.
The Chromosome template table displays the chromosome number and the BP value for each chromosome. This information is based on the content of the input map file. The BP value for each chromosome is not the actual length of the chromosome, but rather the BP value of the last SNP on that chromosome. If you know the actual length of the chromosome, you can replace the BP value with the actual value. After changing the BP values, if you want to save the table, enter a name in the Name text box and click the [Save] button. The name will then be saved in the combo box directly above. To load a saved table later, you just need to select the desired menu item from the combo box. If you want to delete a value in the combo box, select the value you wish to delete and click the [Delete] button.
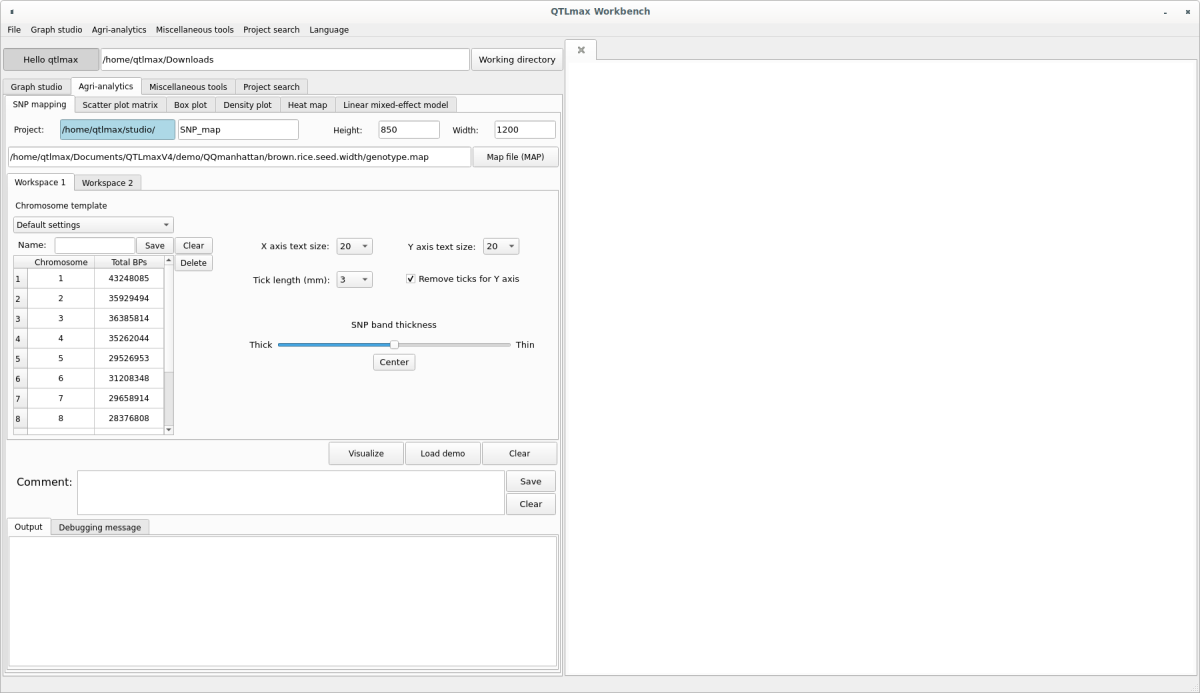
(Figure 2)
Move to the Workspace 2 tab page. Copy and paste the list of SNPs you want to mark on the Chromosome into the ‘SNP list’ box. Then, click the [Filter] button, and blue cells will appear in the ‘SNP bars’ table along with the corresponding SNP information. If you want to mark specific SNPs with a color other than blue, select the corresponding SNP row. Then, click the [Color] button on the right, and a palette will pop up. From there, you can select the desired color to display the selected SNP in your chosen color.
If you want to display a specific SNP with an arrow and text, enter the information for that SNP in the lower part of the ‘SNP list’ box. Set all the configurations for the [CHR] combo box, BP text box, Arrow size text box, Color text box, and Annotation text box. (Figure 3)
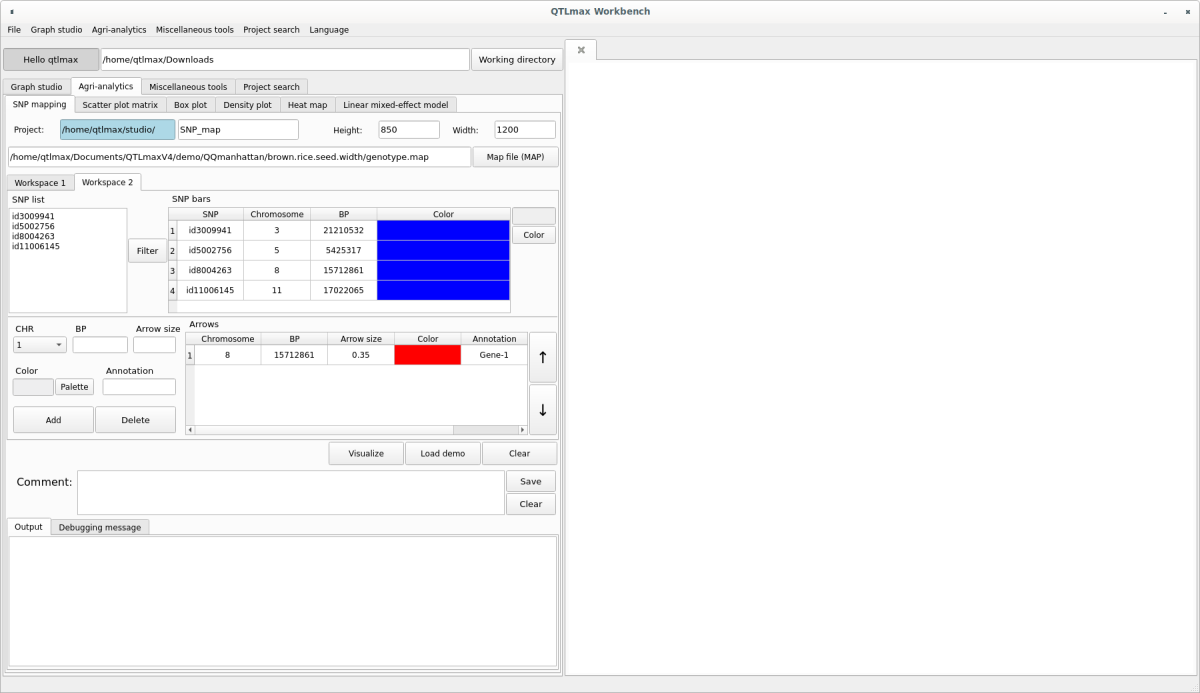
(Figure 3)
After completing all settings and clicking the [Add] button, you can see the finished SNP map displayed on the right-hand drawing panel according to the set conditions (Figure 4). If you want to adjust the thickness of the SNP band or change the font size of the text on the Chromosome template, you can adjust those conditions on the ‘Workspace 1’ tab page. (Figure 2)
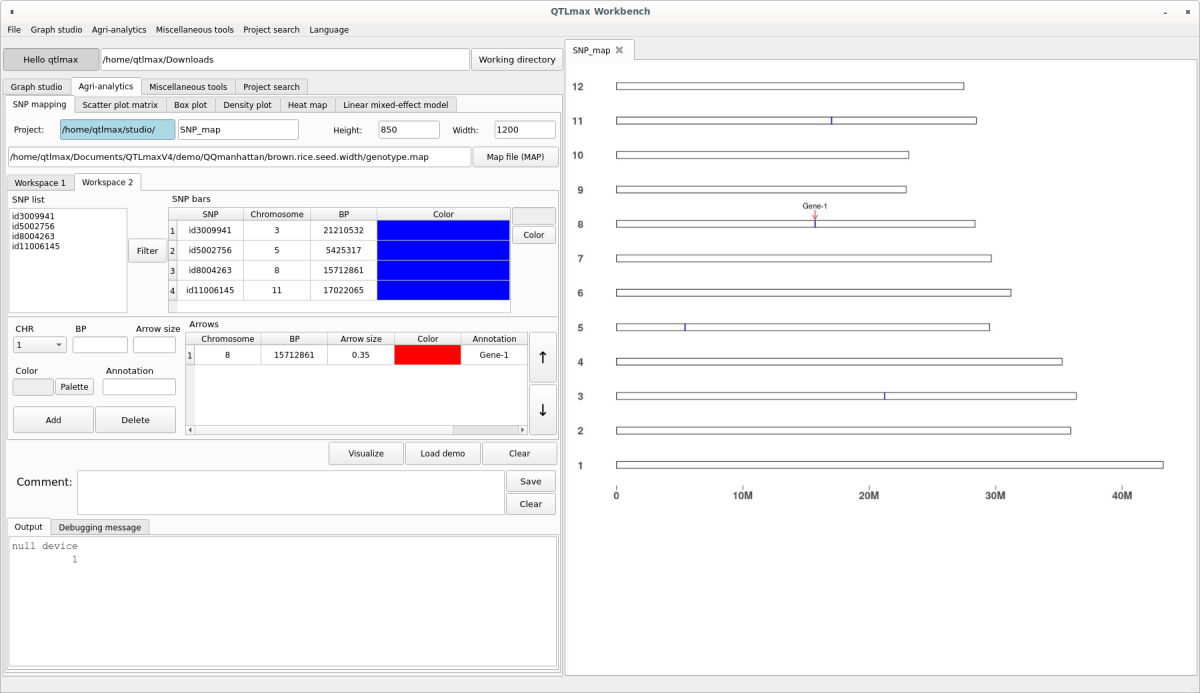
(Fiugre 4)