To draw an LD heatmap, you must first set the genomic window range. To see how to set the genomic window, please click the following link.
How to Set Genomic Window Range
Figure 1 shows the LD heatmap tab page selected. You can see two SNP markers (id5002687, id5002786) selected. These two marker names represent the start and end points of the genomic window defined in the Neighboring SNPs tab.
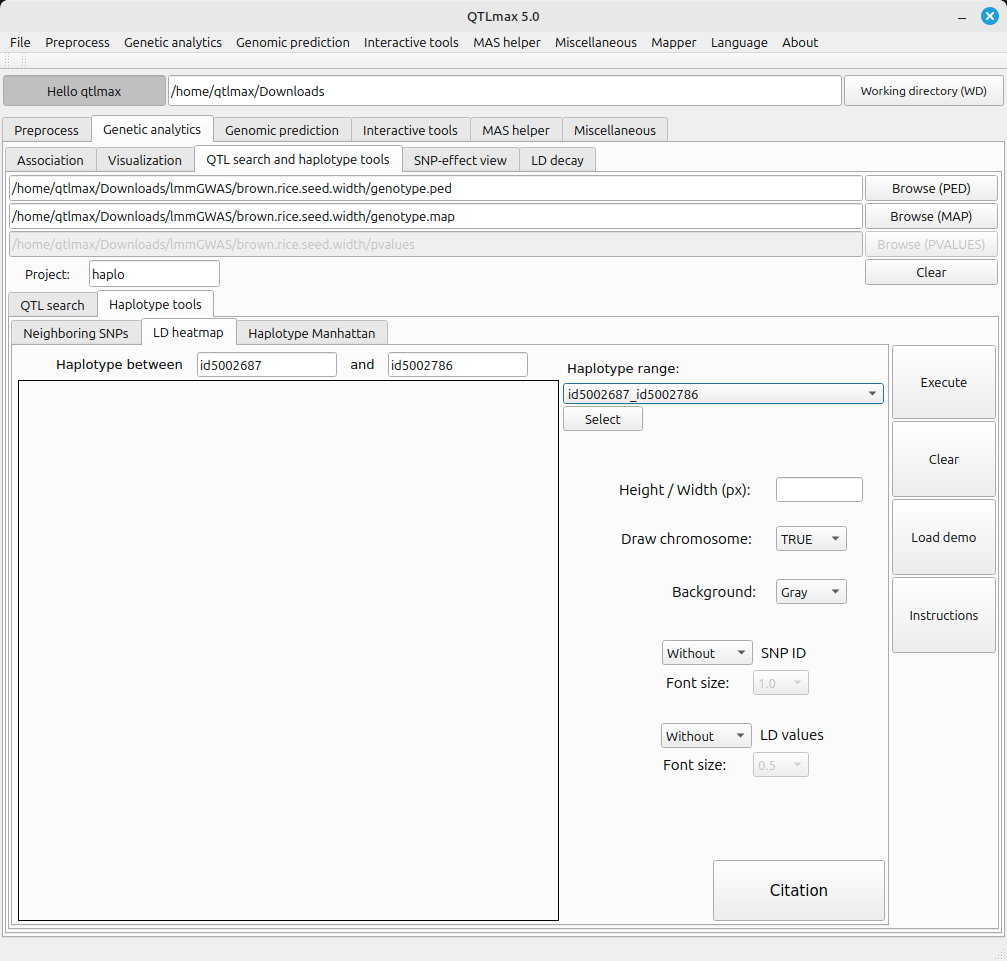
(Figure 1)
You can draw an LD heatmap by entering the desired image size in the ‘Width / Height (px)’ text box and clicking the [Execute] button. (Figure 2)
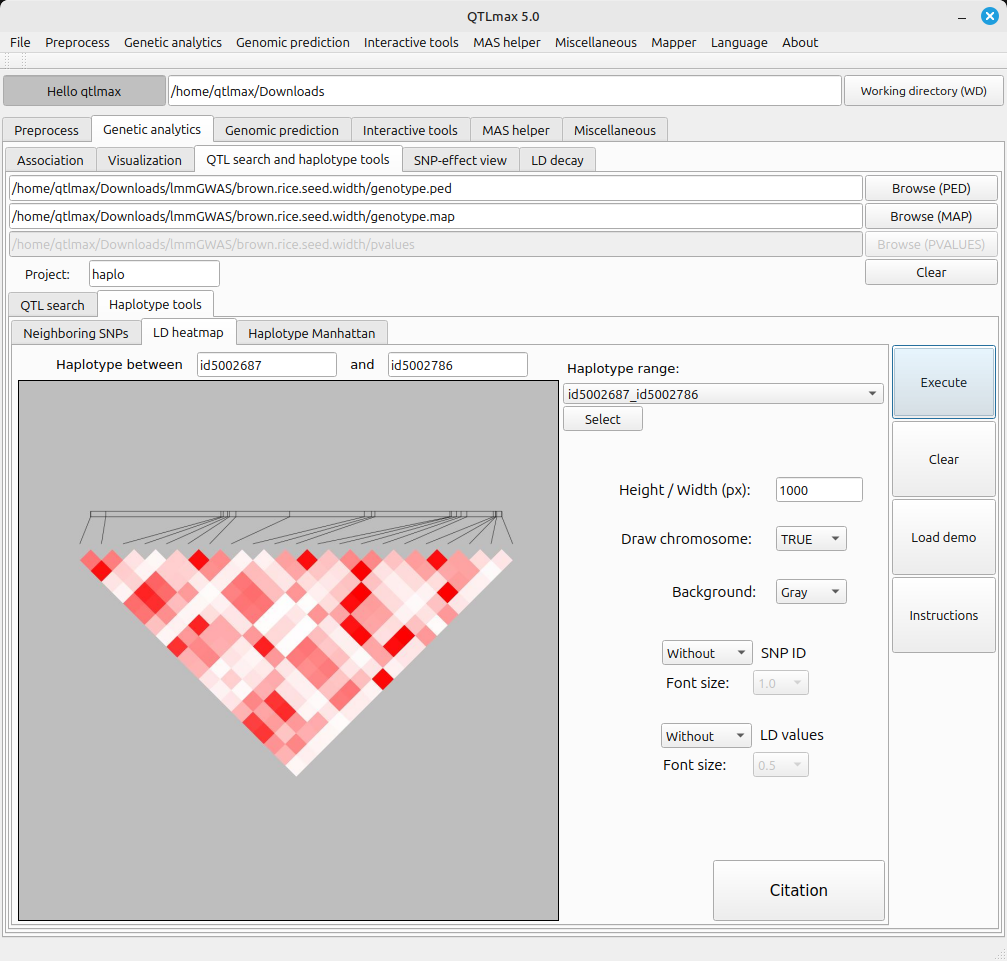
(Figure 2)
By changing the settings of the panel, you can draw LD heatmaps with various appearances. (Figure 3).
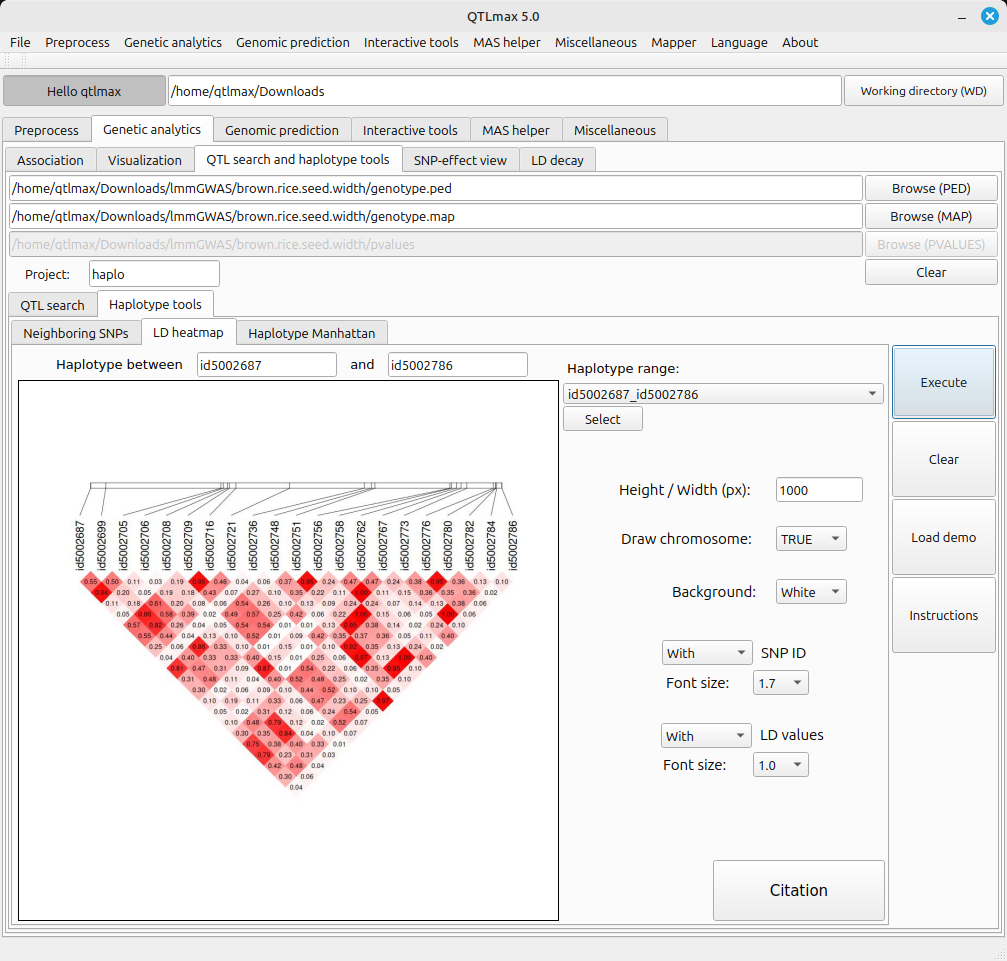
(Figure 3)
- After plotting the LD heatmap, the corresponding file is saved in the project folder. To open that file later, you just need to select the menu value related to that file from the combo box and click the [select] button.
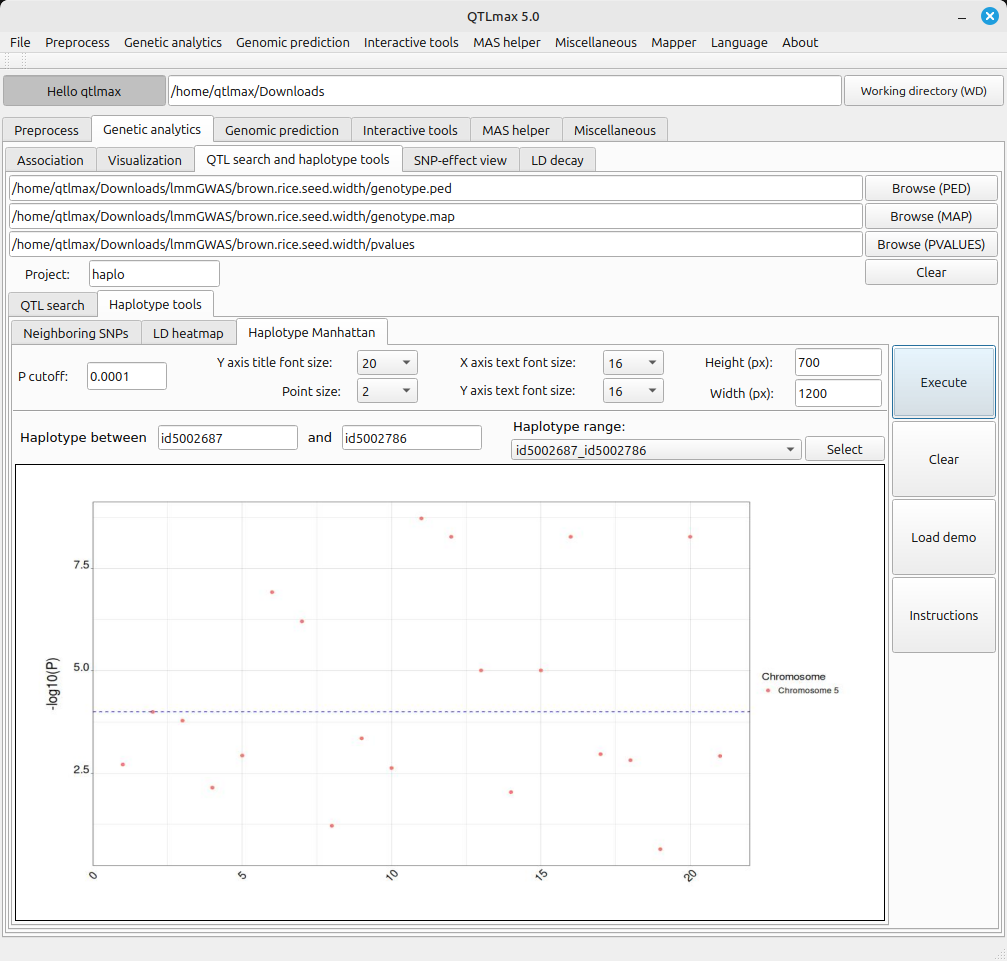
(Figure 4)