(Method 1) Figure 1 shows the results of the SNP table for each chromosome.
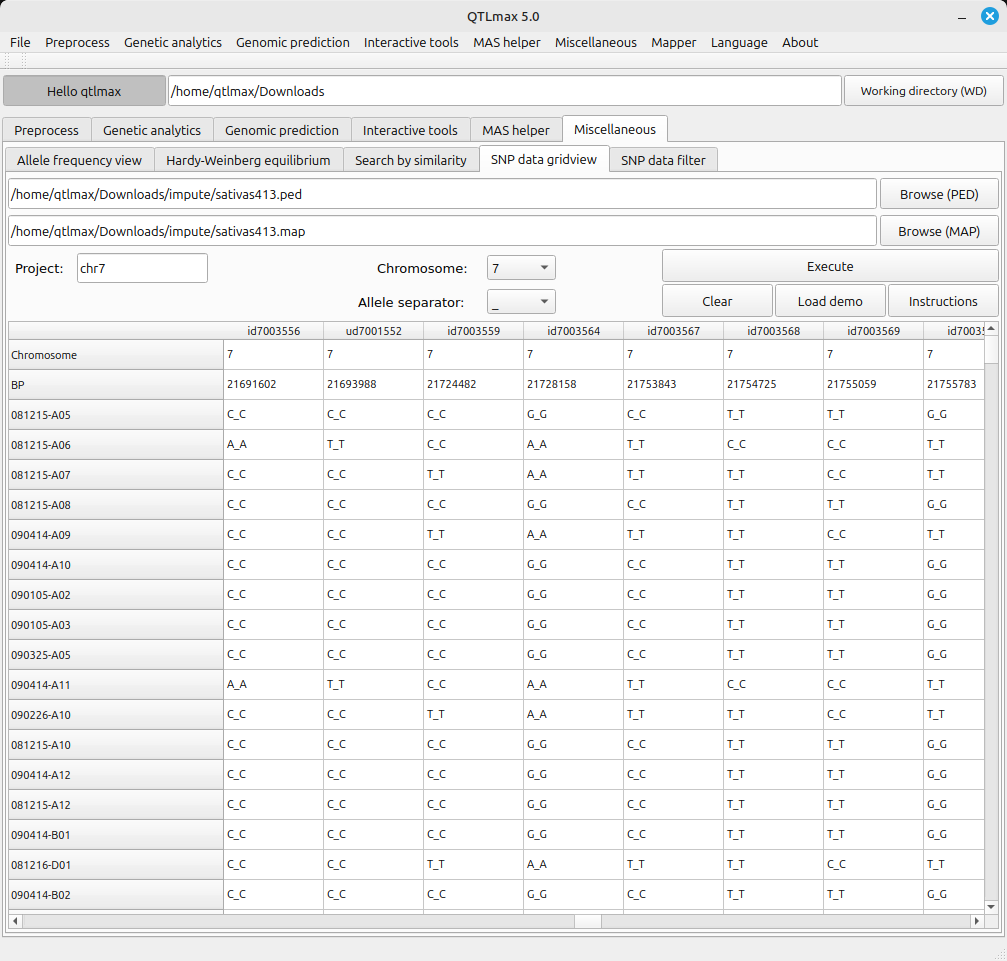
(Figure 1)
(Method 2) Figure 2 shows the SNP values within the user-defined range in a table format.
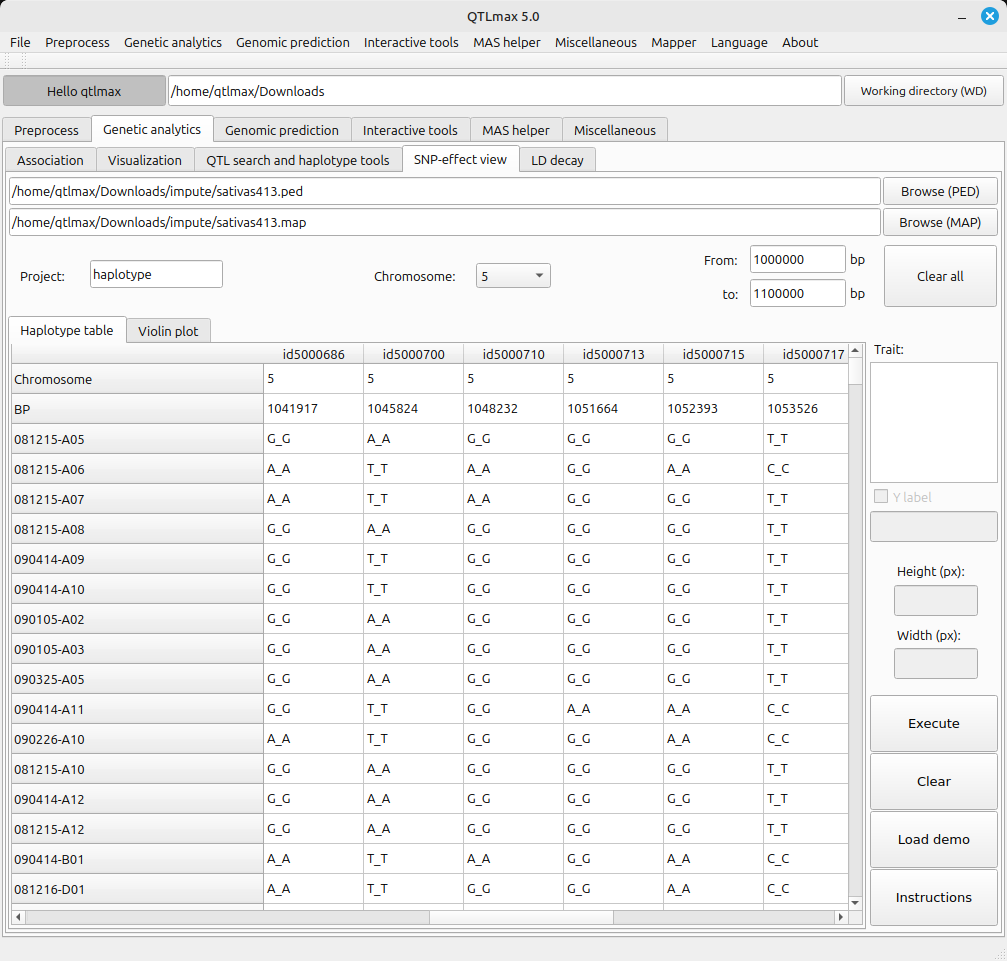
(Figure 2)
(Method 1) Figure 1 shows the results of the SNP table for each chromosome.
(Figure 1)
(Method 2) Figure 2 shows the SNP values within the user-defined range in a table format.
(Figure 2)