1. Automatic upgrade
A manual installation is required only once when you install QTLmax. From that point on, all upgrade will be occurred automatically at the launching QTLmax upon the available new version.
- It is important to note that any files or directories should not be saved under the QTLmax directory: /home/USER/Documents/QTLmax. While an upgrade is being processed, the old QTLmax directory will be replaced by a new QTLmax directory.
2. Tabs in cascaded fashion
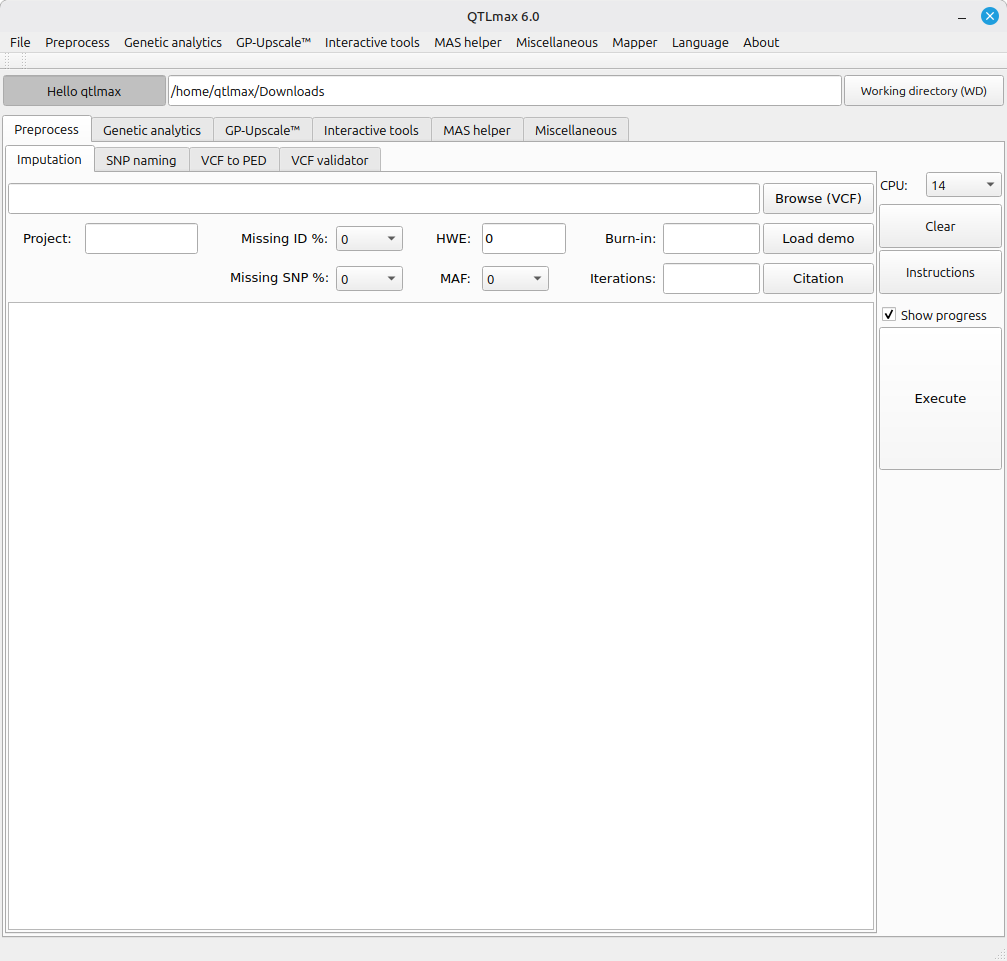
A notable design feature of QTLmax is its use of cascaded tabs, in contrast to other tools that typically organize options within hidden dropdown menus at the top menu bar. Using tabs offers several usability advantages:
- All options are visible at a glance, reducing the need for users to navigate menus.
- Each analytical task is assigned to a separate tab, making navigation straightforward.
- Related tabs are grouped according to task type, further streamlining the workflow.
The tab-based interface is highly effective in maximizing user-friendliness. In general, each tab holds many widgets such as buttons, text boxes, menus, etc; according to QTLmax users, such an interface is visually appealing and easy to use. This positive response aligns with our design intentions.
3. Working directory
You can set your working directory (WD) path. The current WD path is displayed at the top of QTLmax window. You can change this by clicking the ‘Working directory (WD)’ button to launch the navigator. In order to launch the navigator, press on ‘Working directory (WD)’ button. Note that for security in a multi-user environment, access is restricted to your own home directory; you cannot navigate to or access other users’ directories.
4. Seamless input-output formats for continuous analytical chains
QTLmax comprises dozens of executable modules handling both graphical user interfaces (GUI) and computational tasks. To enhance user experience, its I/O design prioritizes consistency in data formats and structures. For example, the imputation work always requires a VCF or VCF.gz only following the industry standard, generating a set of genomic dataset (*.ped, *.map) in the PLINK format . For all other analyses, only PLINK-formatted datasets are required for genomic input data. When the outpt of one analysis is required for the following analysis or visualization, you can directly use it. In this way, the entire chain of analyses can be seamlessly made one after another, which are naturally facilitated by its user-friendly GUI.
5. Demo datasets
Each computational feature includes a demo dataset. Notably, clicking the [Load demo] button automatically loads the dataset along with its example configurations. This allows you to run analyses immediately and learn how to format your own data for future tasks.
6. Parallel computing support
As QTLmax is built for handling large-scale datasets, its computational engines are engineered under scenarios that users need to analyze massive scale of genomic and phenotypic datasets. In fact, this is the primary purpose of QTLmax. To meet these intensive computational demands, many features support CPU parallel computing. Users can easily manage CPU resource usage by selecting an option from the respective dropdown menu. Furthermore, to maintain a stable multi-user environment, the workstation administrator can limit the maximum number of CPU threads available to each user. Starting with QTLmax 6.0, we are introducing a new genomic prediction algorithm called GP-UpscaleTM. As the algortihm performs vastly massive computations, a GPU computing has been introduced. Both CPU and GPU parallel computing can be easily accessed through our user-friendly GUI.
7. Graphics empowered by powerful graphical tools
In QTLmax, we gave due consideration to graphical quality because the analytical outputs are often used for reporting and publications. All graphical features rely on their own GUI so that you can adjust vast sorts of configurations in a sophisticated manner based upon GUI settings. Yet the visualization time is blazing fast as default settings can be loaded upon one click; from that point forward, you can adjust the settings as you desire. Not all but many visualizing features leverage R graphics so that its outputs are in high quality and would be quite familiar to peers. Some visual products are interactive so that you can spin or scale in and out or view tooltip when mouse is over.