This post will explain how to classify individuals within a population into subpopulations using the K-means algorithm.
Figure 1 shows the “K-means clustering” tab selected in QTLmax Super.
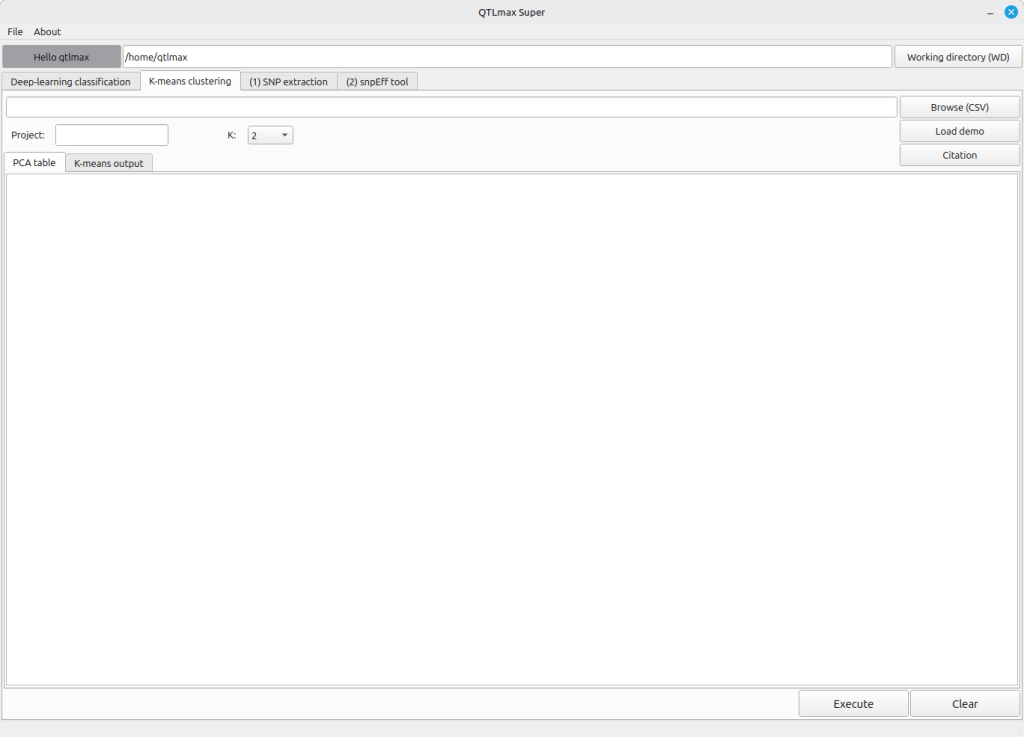
(Figure 1)
Figure 2 shows that a PCA result file has been selected, and that its PCA table is populated accordingly.
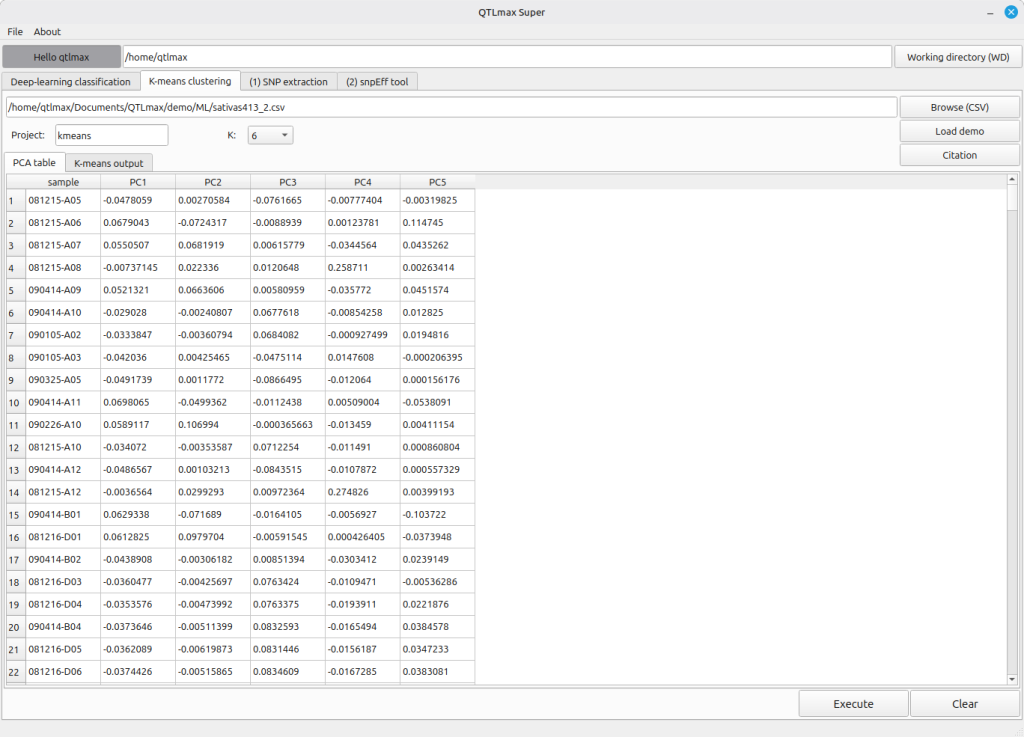
(Figure 2)
After you enter the project name and select the number of groups for the entire population in the K field, click the [Execute] button. You’ll then see the subpopulation class for each individual displayed as a number.
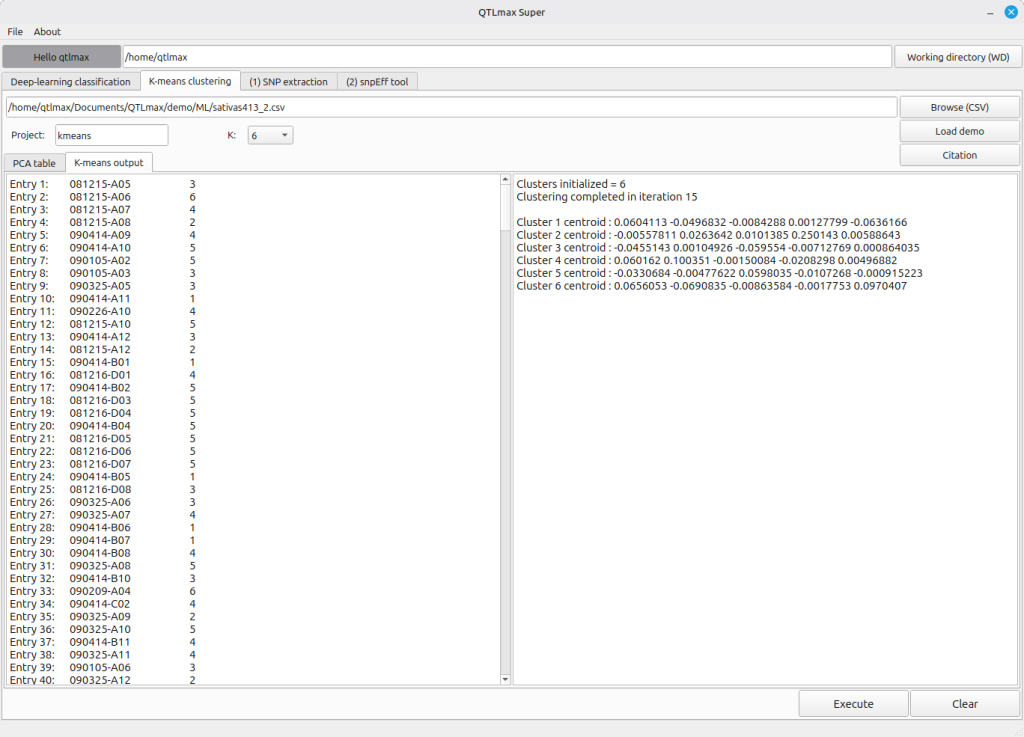
(Figure 3)