This post explains how to predict subpopulation class for individuals given known genomic analytics, using deep learning algorithms.
Figure 1 shows the “Deep-learning classification” tab selected in QTLmax Super.
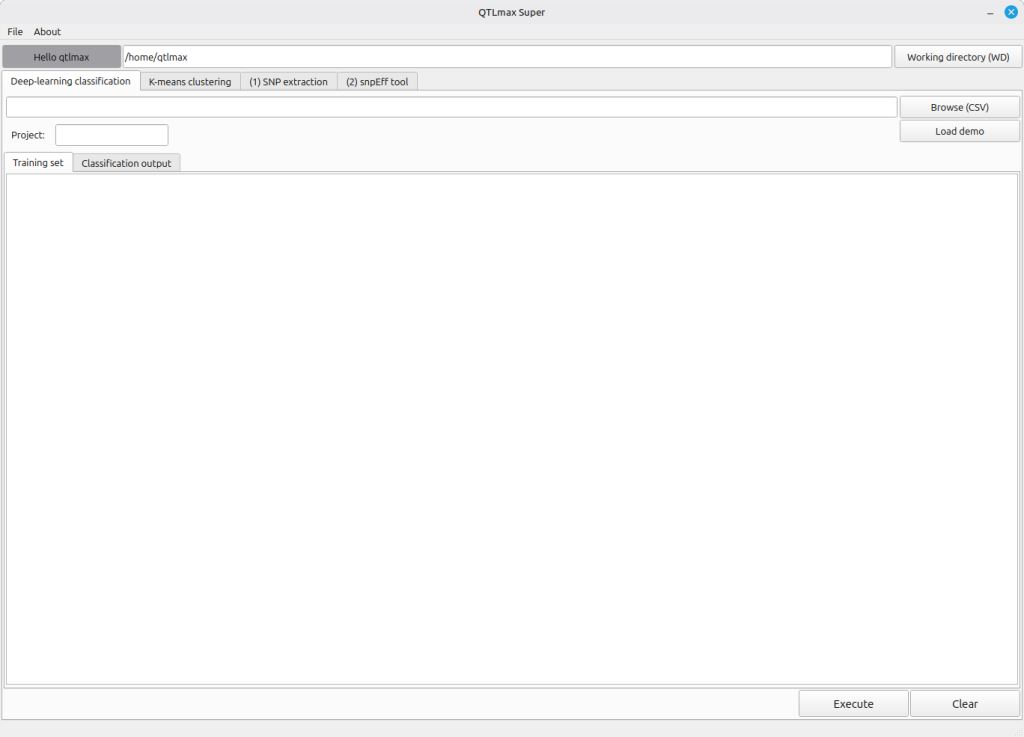
(Figure 1)
The input data format is as shown in Figure 2, which is in the form combining the PCA result table with a “Subpopulation” column. The deep learning algorithm will first perform training on the individuals for whom subpopulation information is available, and then proceed to predict subpopulation values for the individuals without that information. Notably, some entries have no values in column called Subpopulation; the missing values are the ultimate target to be filled out based on its prediction.
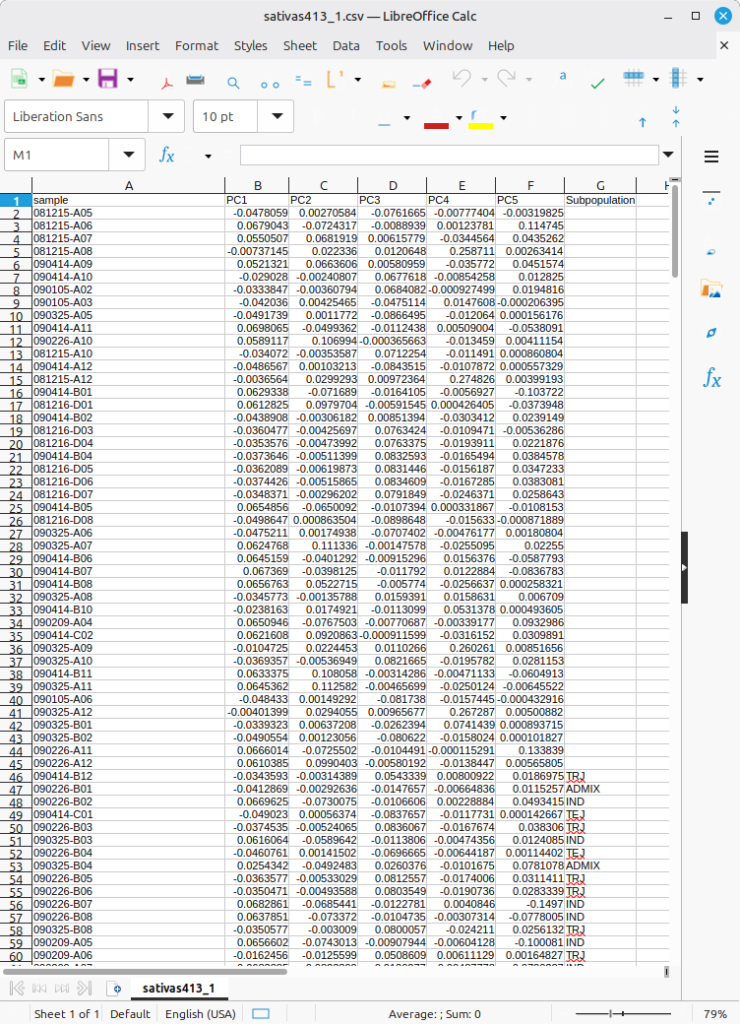
(Figure 2)
When you enter the project name and select the input file, the “Training set” tab will display individuals with subpopulation information.
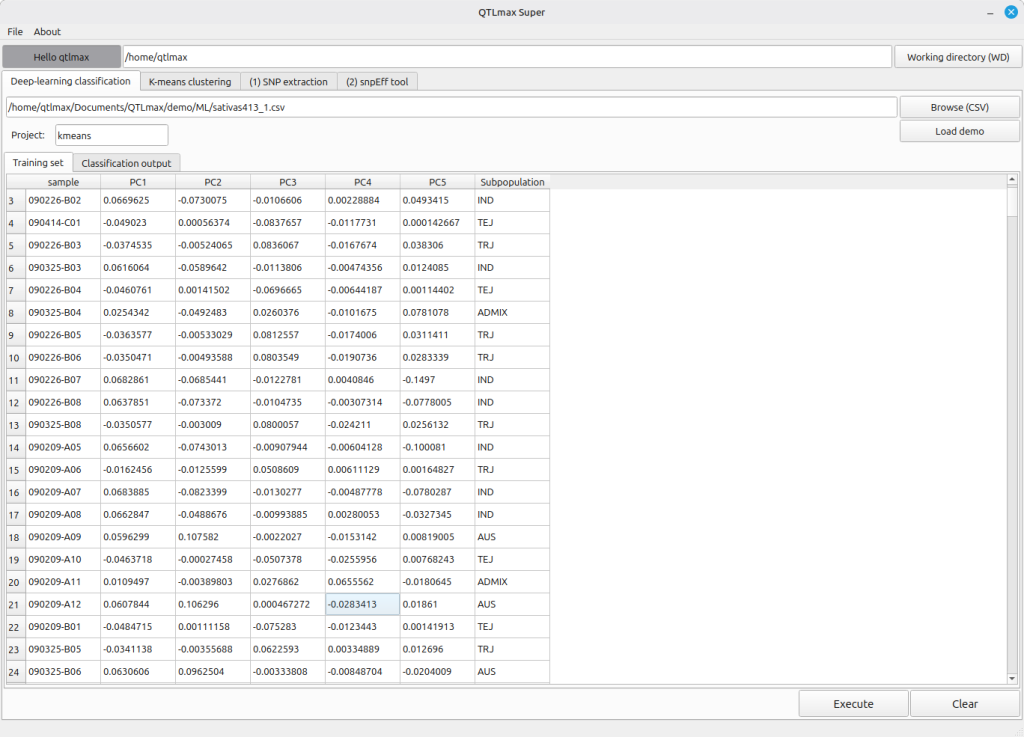
(Figure 3)
When you click the [Execute] button, the deep learning task runs, and you’ll see the subpopulation information generated and displayed for the individuals in the “Classification output” (Figure 4).
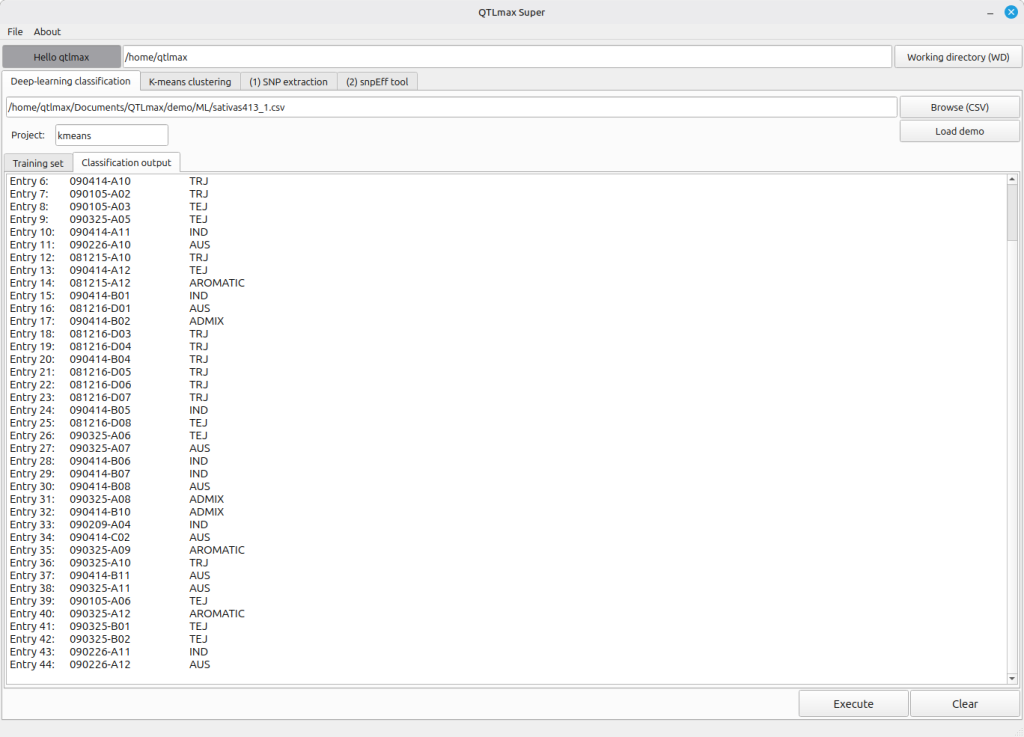
(Figure 4)